Data analysis
Analysis of data is a process of inspecting,
cleaning, transforming, and modeling
data with the goal of discovering
useful
information,
suggesting conclusions, and supporting decision-making. Data analysis has
multiple facets and approaches, encompassing diverse techniques under a variety
of names, in different business, science, and social science domains.
Contents
The process of data analysis

Data science process
flowchart
Analysis refers to
breaking a whole into its separate components for individual examination. Data
analysis is a
process
for obtaining raw data and converting it into information useful for
decision-making by users. Data is collected and analyzed to answer questions,
test hypotheses or disprove theories.
[1]
Statistician
John Tukey defined data
analysis in 1961 as: "Procedures for analyzing data, techniques for
interpreting the results of such procedures, ways of planning the gathering of
data to make its analysis easier, more precise or more accurate, and all the
machinery and results of (mathematical) statistics which apply to analyzing
data."
[2]
There are several
phases that can be distinguished, described below. The phases are iterative, in
that feedback from later phases may result in additional work in earlier
phases.
[3]
Data requirements
The data necessary
as inputs to the analysis are specified based upon the requirements of those
directing the analysis or customers who will use the finished product of the
analysis. The general type of entity upon which the data will be collected is
referred to as an experimental unit (e.g., a person or population of people).
Specific variables regarding a population (e.g., age and income) may be
specified and obtained. Data may be numerical or categorical (i.e., a text
label for numbers).
[3]
Data collection
Data is collected
from a variety of sources. The requirements may be communicated by analysts to
custodians of the data, such as information technology personnel within an
organization. The data may also be collected from sensors in the environment,
such as traffic cameras, satellites, recording devices, etc. It may also be
obtained through interviews, downloads from online sources, or reading
documentation.
[3]
Data processing

The phases of the
intelligence cycle
used to convert raw information into actionable intelligence or knowledge are
conceptually similar to the phases in data analysis.
Data initially
obtained must be processed or organized for analysis. For instance, this may
involve placing data into rows and columns in a table format for further
analysis, such as within a spreadsheet or statistical software.
[3]
Data cleaning
Once processed and
organized, the data may be incomplete, contain duplicates, or contain errors.
The need for data cleaning will arise from problems in the way that data is
entered and stored. Data cleaning is the process of preventing and correcting
these errors. Common tasks include record matching, deduplication, and column
segmentation.
[4] Such data problems can also be
identified through a variety of analytical techniques. For example, with
financial information, the totals for particular variables may be compared
against separately published numbers believed to be reliable.
[5] Unusual amounts above or below
pre-determined thresholds may also be reviewed. There are several types of data
cleaning that depend on the type of data. Quantitative data methods for outlier
detection can be used to get rid of likely incorrectly entered data. Textual
data spellcheckers can be used to lessen the amount of mistyped words, but it
is harder to tell if the words themselves are correct.
[6]
Exploratory data analysis
Once the data is
cleaned, it can be analyzed. Analysts may apply a variety of techniques
referred to as
exploratory
data analysis to begin understanding the messages contained in the data.
[7][8] The process of exploration may
result in additional data cleaning or additional requests for data, so these
activities may be iterative in nature.
Descriptive
statistics such as the average or median may be generated to help
understand the data.
Data
visualization may also be used to examine the data in graphical format, to
obtain additional insight regarding the messages within the data.
[3]
Modeling and algorithms
Mathematical
formulas or models called
algorithms
may be applied to the data to identify relationships among the variables, such
as
correlation
or
causation. In general
terms, models may be developed to evaluate a particular variable in the data
based on other variable(s) in the data, with some residual error depending on
model accuracy (i.e., Data = Model + Error).
[1]
Inferential
statistics includes techniques to measure relationships between particular
variables. For example,
regression analysis
may be used to model whether a change in advertising (independent variable X)
explains the variation in sales (dependent variable Y). In mathematical terms,
Y (sales) is a function of X (advertising). It may be described as Y = aX + b +
error, where the model is designed such that a and b minimize the error when
the model predicts Y for a given range of values of X. Analysts may attempt to
build models that are descriptive of the data to simplify analysis and
communicate results.
[1]
Data product
A data product is a
computer application that takes data inputs and generates outputs, feeding them
back into the environment. It may be based on a model or algorithm. An example
is an application that analyzes data about customer purchasing history and recommends
other purchases the customer might enjoy.
[3]
Communication

Once the data is
analyzed, it may be reported in many formats to the users of the analysis to
support their requirements. The users may have feedback, which results in
additional analysis. As such, much of the analytical cycle is iterative.
[3]
When determining how
to communicate the results, the analyst may consider
data visualization
techniques to help clearly and efficiently communicate the message to the
audience. Data visualization uses
information displays
such as tables and charts to help communicate key messages contained in the
data. Tables are helpful to a user who might lookup specific numbers, while
charts (e.g., bar charts or line charts) may help explain the quantitative
messages contained in the data.
Quantitative messages

A time series
illustrated with a line chart demonstrating trends in U.S. federal spending and
revenue over time.

A scatterplot
illustrating correlation between two variables (inflation and unemployment)
measured at points in time.
Author Stephen Few
described eight types of quantitative messages that users may attempt to
understand or communicate from a set of data and the associated graphs used to
help communicate the message. Customers specifying requirements and analysts
performing the data analysis may consider these messages during the course of
the process.
- Time-series: A single
variable is captured over a period of time, such as the unemployment rate
over a 10-year period. A line chart may be used to demonstrate
the trend.
- Ranking: Categorical
subdivisions are ranked in ascending or descending order, such as a
ranking of sales performance (the measure) by sales persons (the category, with each sales person a categorical
subdivision)
during a single period. A bar chart may be used to show the comparison across the
sales persons.
- Part-to-whole: Categorical
subdivisions are measured as a ratio to the whole (i.e., a percentage out
of 100%). A pie chart or bar chart can show the
comparison of ratios, such as the market share represented by competitors
in a market.
- Deviation: Categorical
subdivisions are compared against a reference, such as a comparison of
actual vs. budget expenses for several departments of a business for a
given time period. A bar chart can show comparison of the actual versus
the reference amount.
- Frequency distribution: Shows
the number of observations of a particular variable for given interval,
such as the number of years in which the stock market return is between
intervals such as 0-10%, 11-20%, etc. A histogram, a type of bar chart, may be used for this
analysis.
- Correlation: Comparison
between observations represented by two variables (X,Y) to determine if
they tend to move in the same or opposite directions. For example,
plotting unemployment (X) and inflation (Y) for a sample of months. A scatter plot is typically used for this message.
- Nominal comparison: Comparing
categorical subdivisions in no particular order, such as the sales volume
by product code. A bar chart may be used for this comparison.
- Geographic or geospatial:
Comparison of a variable across a map or layout, such as the unemployment
rate by state or the number of persons on the various floors of a
building. A cartogram is a typical graphic used.[10][11]
Techniques for analyzing quantitative data
Author Jonathan
Koomey has recommended a series of best practices for understanding
quantitative data. These include:
- Check raw data for anomalies
prior to performing your analysis;
- Re-perform important
calculations, such as verifying columns of data that are formula driven;
- Confirm main totals are the
sum of subtotals;
- Check relationships between
numbers that should be related in a predictable way, such as ratios over
time;
- Normalize numbers to make
comparisons easier, such as analyzing amounts per person or relative to
GDP or as an index value relative to a base year;
- Break problems into component
parts by analyzing factors that led to the results, such as DuPont analysis of return on equity.[5]

The consultants at
McKinsey and Company
named a technique for breaking a quantitative problem down into its component
parts called the
MECE
principle. Each layer can be broken down into its components; each of the
sub-components must be
mutually
exclusive of each other and
collectively
add up to the layer above them. The relationship is referred to as
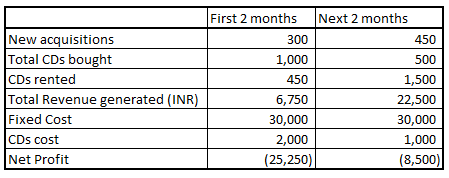
"Mutually Exclusive and Collectively Exhaustive" or MECE. For
example, profit by definition can be broken down into total revenue and total
cost. In turn, total revenue can be analyzed by its components, such as revenue
of divisions A, B, and C (which are mutually exclusive of each other) and
should add to the total revenue (collectively exhaustive).
Analysts may use
robust statistical measurements to solve certain analytical problems.
Hypothesis testing
is used when a particular hypothesis about the true state of affairs is made by
the analyst and data is gathered to determine whether that state of affairs is
true or false. For example, the hypothesis might be that "Unemployment has
no effect on inflation", which relates to an economics concept called the
Phillips Curve.
Hypothesis testing involves considering the likelihood of
Type I and type
II errors, which relate to whether the data supports accepting or rejecting
the hypothesis.
Regression analysis
may be used when the analyst is trying to determine the extent to which
independent variable X affects dependent variable Y (e.g., "To what extent
do changes in the unemployment rate (X) affect the inflation rate (Y)?").
This is an attempt to model or fit an equation line or curve to the data, such
that Y is a function of X.
Analytical activities of data users
Users may have
particular data points of interest within a data set, as opposed to general
messaging outlined above. Such low-level user analytic activities are presented
in the following table. The taxonomy can also be organized by three poles of
activities: retrieving values, finding data points, and arranging data points.
[12][13][14]
|
#
|
Task
|
General
Description
|
Pro Forma
Abstract
|
Examples
|
|
1
|
Retrieve Value
|
Given a set of
specific cases, find attributes of those cases.
|
What are the
values of attributes {X, Y, Z, ...} in the data cases {A, B, C, ...}?
|
- What is the mileage per gallon of the Audi TT?
- How long is the movie Gone with the Wind?
|
|
2
|
Filter
|
Given some
concrete conditions on attribute values, find data cases satisfying those
conditions.
|
Which data cases
satisfy conditions {A, B, C...}?
|
- What Kellogg's cereals have high fiber?
- What comedies have won awards?
- Which funds underperformed the SP-500?
|
|
3
|
Compute Derived Value
|
Given a set of
data cases, compute an aggregate numeric representation of those data cases.
|
What is the value
of aggregation function F over a given set S of data cases?
|
- What is the average calorie content of Post
cereals?
- What is the gross income of all stores combined?
- How many manufacturers of cars are there?
|
|
4
|
Find Extremum
|
Find data cases
possessing an extreme value of an attribute over its range within the data
set.
|
What are the
top/bottom N data cases with respect to attribute A?
|
- What is the car with the highest MPG?
- What director/film has won the most awards?
- What Robin Williams film has the most recent
release date?
|
|
5
|
Sort
|
Given a set of
data cases, rank them according to some ordinal metric.
|
What is the sorted
order of a set S of data cases according to their value of attribute A?
|
- Order the cars by weight.
- Rank the cereals by calories.
|
|
6
|
Determine Range
|
Given a set of
data cases and an attribute of interest, find the span of values within the
set.
|
What is the range
of values of attribute A in a set S of data cases?
|
- What is the range of film lengths?
- What is the range of car horsepowers?
- What actresses are in the data set?
|
|
7
|
Characterize Distribution
|
Given a set of
data cases and a quantitative attribute of interest, characterize the
distribution of that attribute’s values over the set.
|
What is the
distribution of values of attribute A in a set S of data cases?
|
- What is the distribution of carbohydrates in
cereals?
- What is the age distribution of shoppers?
|
|
8
|
Find Anomalies
|
Identify any
anomalies within a given set of data cases with respect to a given
relationship or expectation, e.g. statistical outliers.
|
Which data cases
in a set S of data cases have unexpected/exceptional values?
|
- Are there exceptions to the relationship between
horsepower and acceleration?
- Are there any outliers in protein?
|
|
9
|
Cluster
|
Given a set of
data cases, find clusters of similar attribute values.
|
Which data cases
in a set S of data cases are similar in value for attributes {X, Y, Z, ...}?
|
- Are there groups of cereals w/ similar
fat/calories/sugar?
- Is there a cluster of typical film lengths?
|
|
10
|
Correlate
|
Given a set of
data cases and two attributes, determine useful relationships between the
values of those attributes.
|
What is the
correlation between attributes X and Y over a given set S of data cases?
|
- Is there a correlation between carbohydrates and
fat?
- Is there a correlation between country of origin
and MPG?
- Do different genders have a preferred payment
method?
- Is there a trend of increasing film length over
the years?
|
Barriers to effective analysis
Barriers to
effective analysis may exist among the analysts performing the data analysis or
among the audience. Distinguishing fact from opinion, cognitive biases, and
innumeracy are all challenges to sound data analysis.
Confusing fact and opinion
You are entitled to
your own opinion, but you are not entitled to your own facts.
Effective analysis
requires obtaining relevant
facts
to answer questions, support a conclusion or formal
opinion, or test
hypotheses. Facts by
definition are irrefutable, meaning that any person involved in the analysis
should be able to agree upon them. For example, in August 2010, the
Congressional
Budget Office (CBO) estimated that extending the
Bush tax cuts of 2001
and 2003 for the 2011-2020 time period would add approximately $3.3 trillion to
the national debt.
[15] Everyone should be able to agree
that indeed this is what CBO reported; they can all examine the report. This
makes it a fact. Whether persons agree or disagree with the CBO is their own
opinion.
As another example,
the auditor of a public company must arrive at a formal opinion on whether
financial statements of publicly traded corporations are "fairly stated,
in all material respects." This requires extensive analysis of factual
data and evidence to support their opinion. When making the leap from facts to
opinions, there is always the possibility that the opinion is
erroneous.
Cognitive biases
There are a variety
of
cognitive biases
that can adversely effect analysis. For example,
confirmation bias is
the tendency to search for or interpret information in a way that confirms
one's preconceptions. In addition, individuals may discredit information that
does not support their views.
Analysts may be
trained specifically to be aware of these biases and how to overcome them. In
his book
Psychology of Intelligence Analysis,
retired CIA analyst
Richards
Heuer wrote that analysts should clearly delineate their assumptions and
chains of inference and specify the degree and source of the uncertainty
involved in the conclusions. He emphasized procedures to help surface and
debate alternative points of view.
[16]
Innumeracy
Effective analysts
are generally adept with a variety of numerical techniques. However, audiences
may not have such literacy with numbers or
numeracy; they are said to be
innumerate. Persons communicating the data may also be attempting to mislead or
misinform, deliberately using bad numerical techniques.
[17]
For example, whether
a number is rising or falling may not be the key factor. More important may be
the number relative to another number, such as the size of government revenue
or spending relative to the size of the economy (GDP) or the amount of cost relative
to revenue in corporate financial statements. This numerical technique is
referred to as normalization
[5] or common-sizing. There are many
such techniques employed by analysts, whether adjusting for inflation (i.e.,
comparing real vs. nominal data) or considering population increases,
demographics, etc. Analysts apply a variety of techniques to address the various
quantitative messages described in the section above.
Analysts may also
analyze data under different assumptions or scenarios. For example, when
analysts perform
financial
statement analysis, they will often recast the financial statements under
different assumptions to help arrive at an estimate of future cash flow, which
they then discount to present value based on some interest rate, to determine
the valuation of the company or its stock. Similarly, the CBO analyzes the
effects of various policy options on the government's revenue, outlays and
deficits, creating alternative future scenarios for key measures.
Other topics
Analytics and business intelligence
Analytics is the
"extensive use of data, statistical and quantitative analysis, explanatory
and predictive models, and fact-based management to drive decisions and
actions." It is a subset of
business
intelligence, which is a set of technologies and processes that use data to
understand and analyze business performance.
[18]
Education

Analytic activities
of data visualization users
In
education, most educators
have access to a
data
system for the purpose of analyzing student data.
[19] These data systems present data to
educators in an
over-the-counter
data format (embedding labels, supplemental documentation, and a help
system and making key package/display and content decisions) to improve the
accuracy of educators’ data analyses.
[20]
Practitioner notes
This section
contains rather technical explanations that may assist practitioners but are
beyond the typical scope of a Wikipedia article.
Initial data analysis
The most important
distinction between the initial data analysis phase and the main analysis
phase, is that during initial data analysis one refrains from any analysis that
is aimed at answering the original research question. The initial data analysis
phase is guided by the following four questions:
[21]
Quality of data
The quality of the
data should be checked as early as possible. Data quality can be assessed in
several ways, using different types of analysis: frequency counts, descriptive
statistics (mean, standard deviation, median), normality (skewness, kurtosis, frequency
histograms, n: variables are compared with coding schemes of variables external
to the data set, and possibly corrected if coding schemes are not comparable.
The choice of
analyses to assess the data quality during the initial data analysis phase
depends on the analyses that will be conducted in the main analysis phase.
[22]
Quality of measurements
The quality of the
measurement
instruments should only be checked during the initial data analysis phase
when this is not the focus or research question of the study. One should check
whether structure of measurement instruments corresponds to structure reported
in the literature.
There are two ways
to assess measurement
- Analysis of homogeneity (internal consistency), which gives an indication
of the reliability of a measurement instrument.
During this analysis, one inspects the variances of the items and the
scales, the Cronbach's α of the scales, and the
change in the Cronbach's alpha when an item would be deleted from a scale.[23]
Initial transformations
After assessing the
quality of the data and of the measurements, one might decide to impute missing
data, or to perform initial transformations of one or more variables, although
this can also be done during the main analysis phase.
[24]
Possible
transformations of variables are:
[25]
- Square root transformation
(if the distribution differs moderately from normal)
- Log-transformation (if the
distribution differs substantially from normal)
- Inverse transformation (if
the distribution differs severely from normal)
- Make categorical (ordinal /
dichotomous) (if the distribution differs severely from normal, and no
transformations help)
Did the implementation of the study fulfill the
intentions of the research design?
One should check the
success of the
randomization
procedure, for instance by checking whether background and substantive
variables are equally distributed within and across groups.
If the study did not
need or use a randomization procedure, one should check the success of the
non-random sampling, for instance by checking whether all subgroups of the
population of interest are represented in sample.
Other possible data
distortions that should be checked are:
- dropout (this should be identified
during the initial data analysis phase)
- Item nonresponse (whether this is random or not should be
assessed during the initial data analysis phase)
- Treatment quality (using manipulation checks).[26]
Characteristics of data sample
In any report or
article, the structure of the sample must be accurately described. It is
especially important to exactly determine the structure of the sample (and
specifically the size of the subgroups) when subgroup analyses will be
performed during the main analysis phase.
The characteristics
of the data sample can be assessed by looking at:
- Basic statistics of important
variables
- Scatter plots
- Correlations and associations
- Cross-tabulations[27]
Final stage of the initial data analysis
During the final
stage, the findings of the initial data analysis are documented, and necessary,
preferable, and possible corrective actions are taken.
Also, the original
plan for the main data analyses can and should be specified in more detail or
rewritten.
In order to do this,
several decisions about the main data analyses can and should be made:
- In the case of non-normals: should one transform variables; make variables
categorical (ordinal/dichotomous); adapt the analysis method?
- In the case of missing data: should one neglect or impute the missing data;
which imputation technique should be used?
- In the case of outliers: should one use robust analysis techniques?
- In case items do not fit the
scale: should one adapt the measurement instrument by omitting items, or
rather ensure comparability with other (uses of the) measurement
instrument(s)?
- In the case of (too) small
subgroups: should one drop the hypothesis about inter-group differences,
or use small sample techniques, like exact tests or bootstrapping?
- In case the randomization procedure seems to be defective: can and should
one calculate propensity scores and include them as
covariates in the main analyses?[28]
Analysis
Several analyses can
be used during the initial data analysis phase:
[29]
- Univariate statistics (single
variable)
- Bivariate associations
(correlations)
- Graphical techniques (scatter
plots)
It is important to
take the measurement levels of the variables into account for the analyses, as
special statistical techniques are available for each level:
[30]
- Nominal and ordinal variables
- Frequency counts (numbers
and percentages)
- Associations
- circumambulations
(crosstabulations)
- hierarchical loglinear
analysis (restricted to a maximum of 8 variables)
- loglinear analysis (to
identify relevant/important variables and possible confounders)
- Exact tests or bootstrapping
(in case subgroups are small)
- Computation of new variables
- Continuous variables
- Distribution
- Statistics (M, SD,
variance, skewness, kurtosis)
- Stem-and-leaf displays
- Box plots
Nonlinear analysis
Main data analysis
In the main analysis
phase analyses aimed at answering the research question are performed as well
as any other relevant analysis needed to write the first draft of the research
report.
[32]
Exploratory and confirmatory approaches
In the main analysis
phase either an exploratory or confirmatory approach can be adopted. Usually
the approach is decided before data is collected. In an exploratory analysis no
clear hypothesis is stated before analysing the data, and the data is searched
for models that describe the data well. In a confirmatory analysis clear
hypotheses about the data are tested.
Exploratory data
analysis should be interpreted carefully. When testing multiple models at
once there is a high chance on finding at least one of them to be significant,
but this can be due to a
type
1 error. It is important to always adjust the significance level when
testing multiple models with, for example, a
Bonferroni
correction. Also, one should not follow up an exploratory analysis with a
confirmatory analysis in the same dataset. An exploratory analysis is used to
find ideas for a theory, but not to test that theory as well. When a model is
found exploratory in a dataset, then following up that analysis with a
confirmatory analysis in the same dataset could simply mean that the results of
the confirmatory analysis are due to the same
type 1 error that
resulted in the exploratory model in the first place. The confirmatory analysis
therefore will not be more informative than the original exploratory analysis.
[33]
Stability of results
It is important to
obtain some indication about how generalizable the results are.
[34] While this is hard to check, one
can look at the stability of the results. Are the results reliable and
reproducible? There are two main ways of doing this:
- Cross-validation: By splitting the data in
multiple parts we can check if an analysis (like a fitted model) based on
one part of the data generalizes to another part of the data as well.
- Sensitivity analysis: A procedure to study the
behavior of a system or model when global parameters are (systematically)
varied. One way to do this is with bootstrapping.
Statistical methods
Many statistical
methods have been used for statistical analyses. A very brief list of four of
the more popular methods is:
Free software for data analysis
- Data Applied - an online data mining and data visualization
solution.
- DataMelt - a multiplatform (Java-based) data analysis
framework from the jWork.ORG community of developers led
by Dr. S.Chekanov
- DevInfo - a database system endorsed by the United Nations Development
Group for
monitoring and analyzing human development.
- ELKI - data mining framework in Java with data mining
oriented visualization functions.
- KNIME - the Konstanz Information Miner, a user friendly and
comprehensive data analytics framework.
- MEPX - cross platform tool for regression and classification
problems.
- PAW - FORTRAN/C data analysis
framework developed at CERN
- Orange - A visual programming tool
featuring interactive data visualization and methods for statistical
data analysis, data mining, and machine learning.
- R - a programming language and
software environment for statistical computing and graphics.
- ROOT - C++ data analysis framework developed at CERN
- dotplot - cloud based
visual designer to create analytic models[35]
- SciPy - A set of Python tools for data analysis http://scipy.org/stackspec.html
- Statsmodels - a Python module
that allows users to explore data, estimate statistical models, and
perform statistical tests http://statsmodels.sourceforge.net/
- Pandas - A software library written
for the Python programming language for data manipulation and analysis.
- myInvenio [36]- a cloud based solution to automatically discover
processes
from event logs.